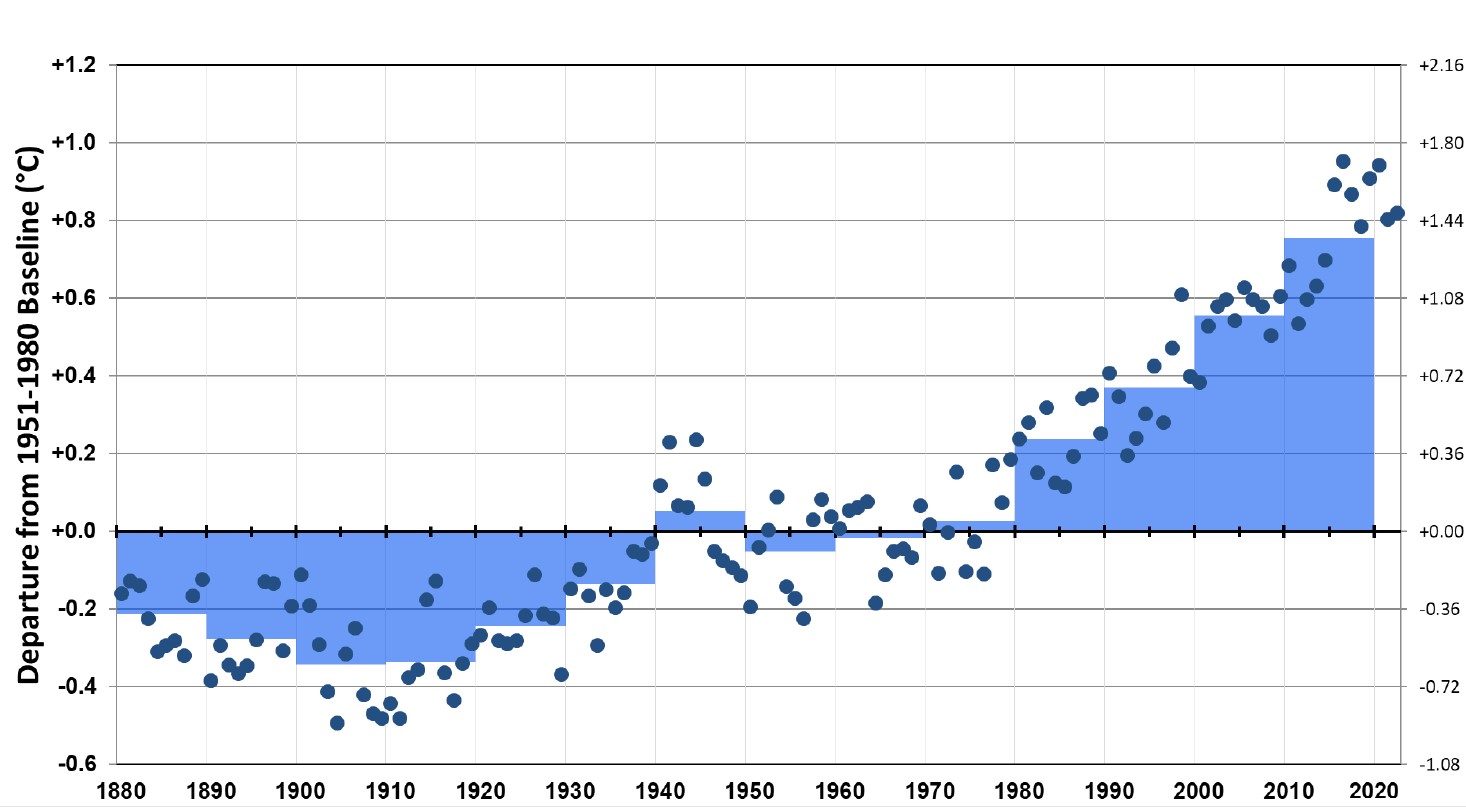
They say history repeats, but usually they don’t mean it quite this literally. The global average surface temperature in 2021 ended up ranking fifth warmest or sixth warmest, depending on the dataset. We now have the tally for 2022—and it’s the new fifth or sixth warmest, depending on the dataset.
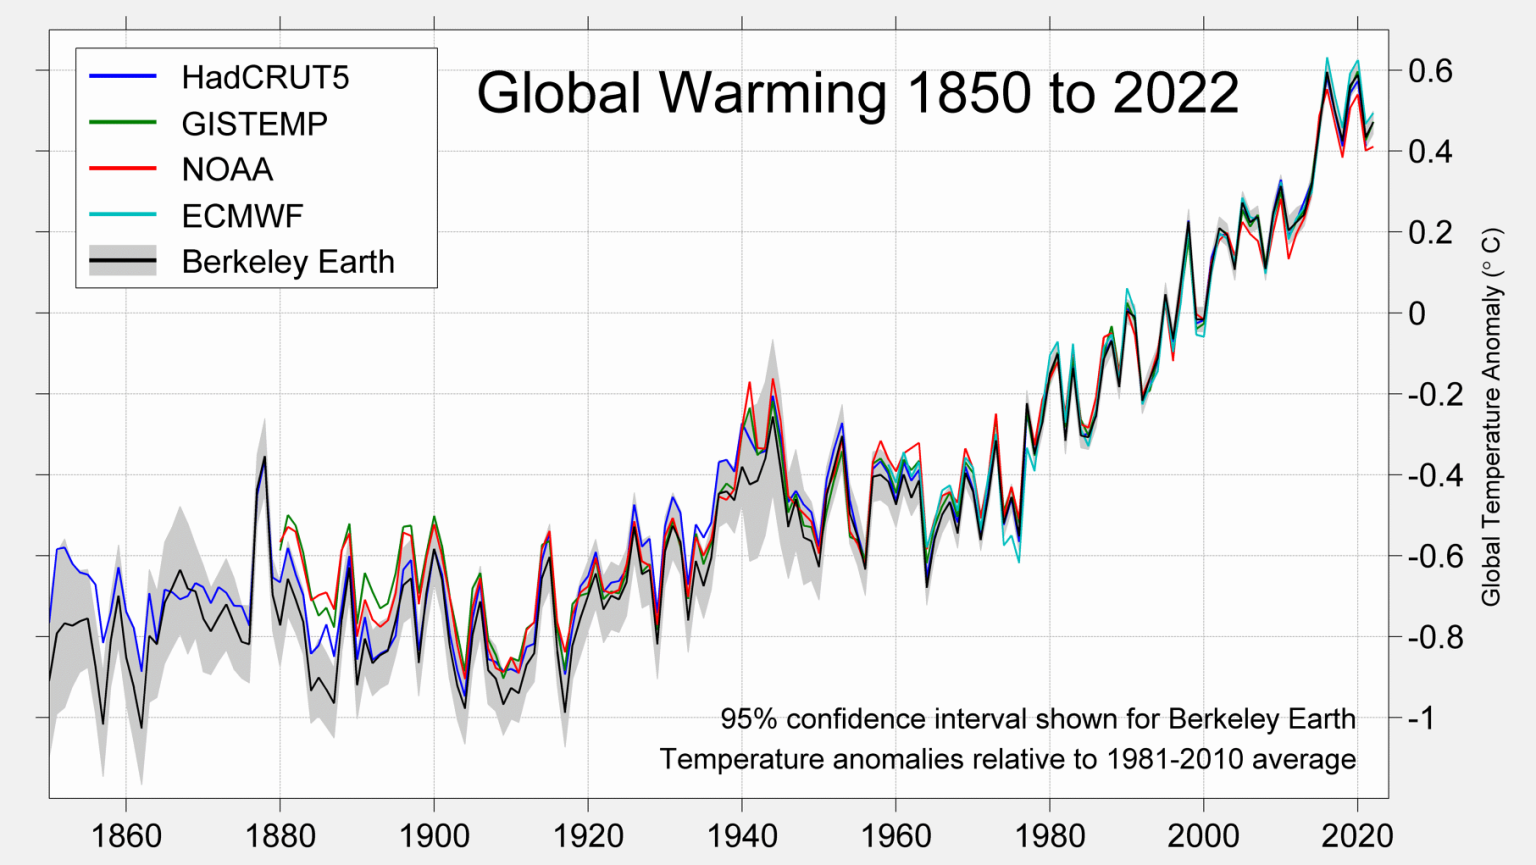
Each year in mid-January, various centers that manage global temperature datasets release their results for the previous year. Because each group pulls from a slightly different collection of weather stations and uses a slightly different calculation process, they don’t get exactly the same numbers. The big picture is identical, but since just 0.01°C can separate years in the ranking, those small differences can alter the order.
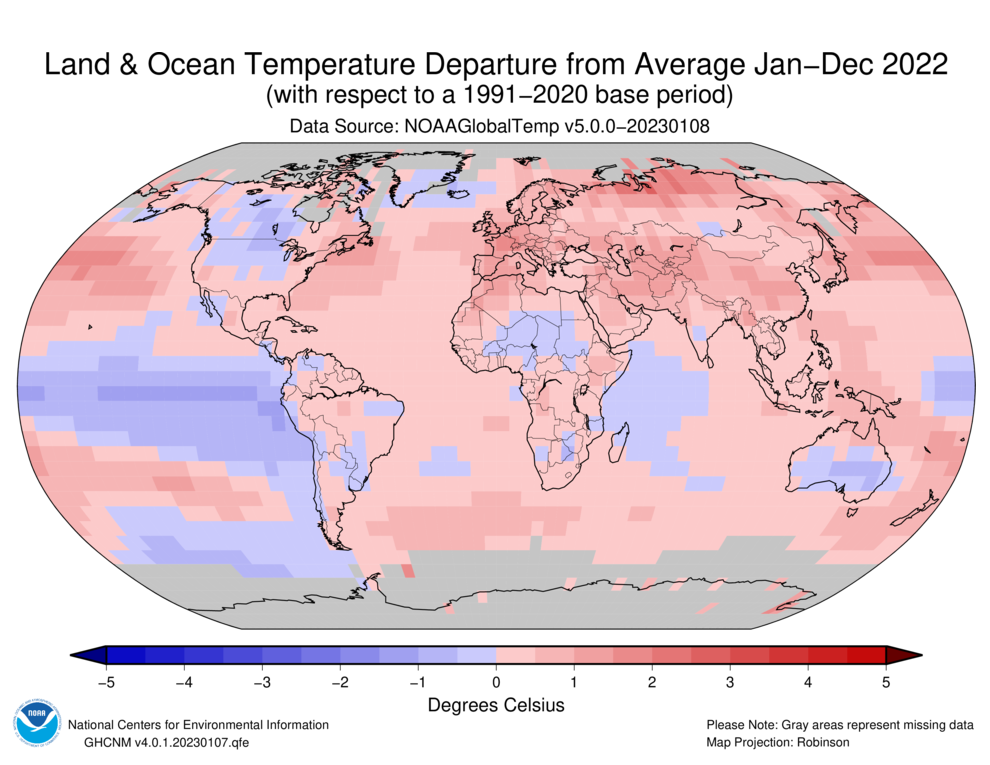
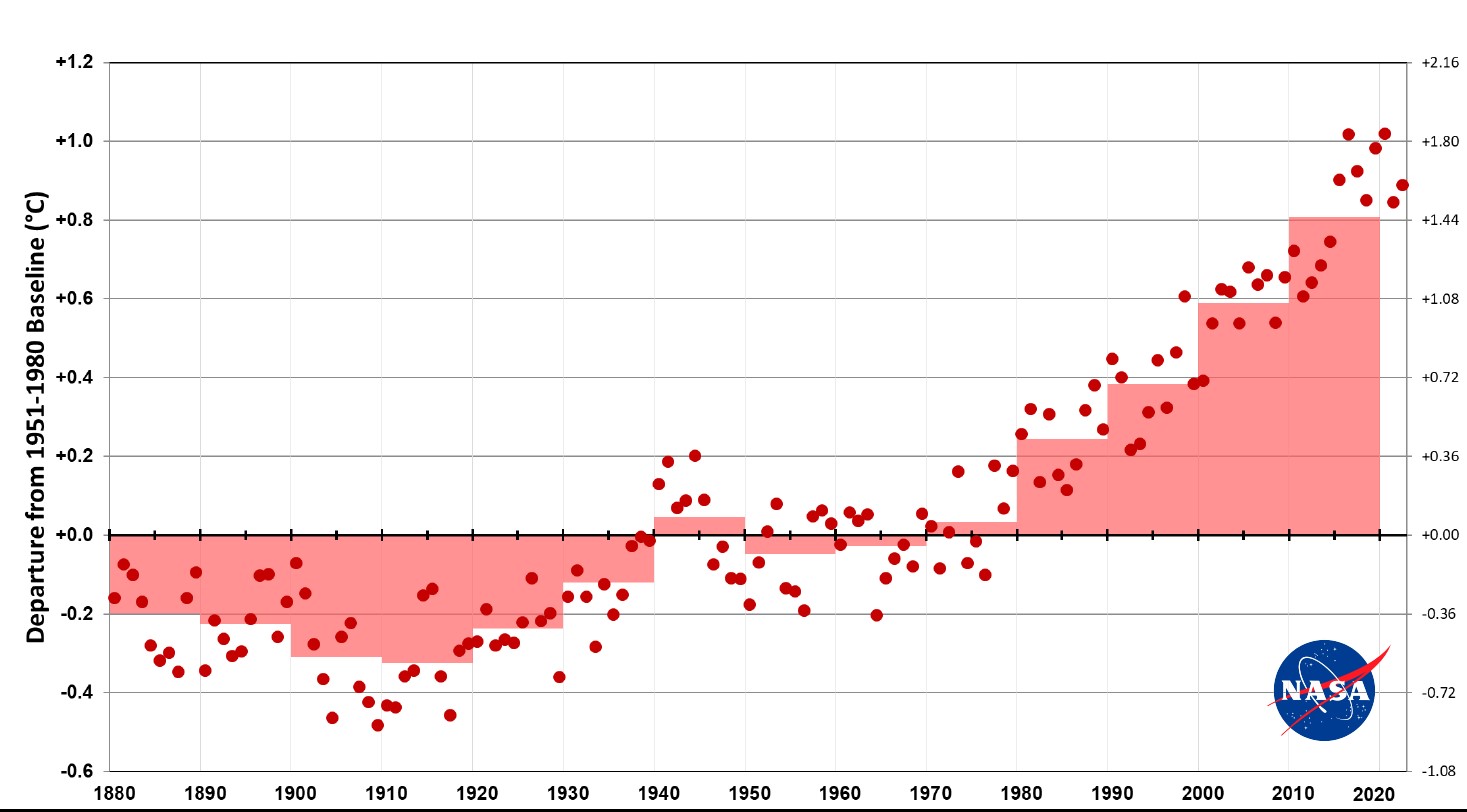
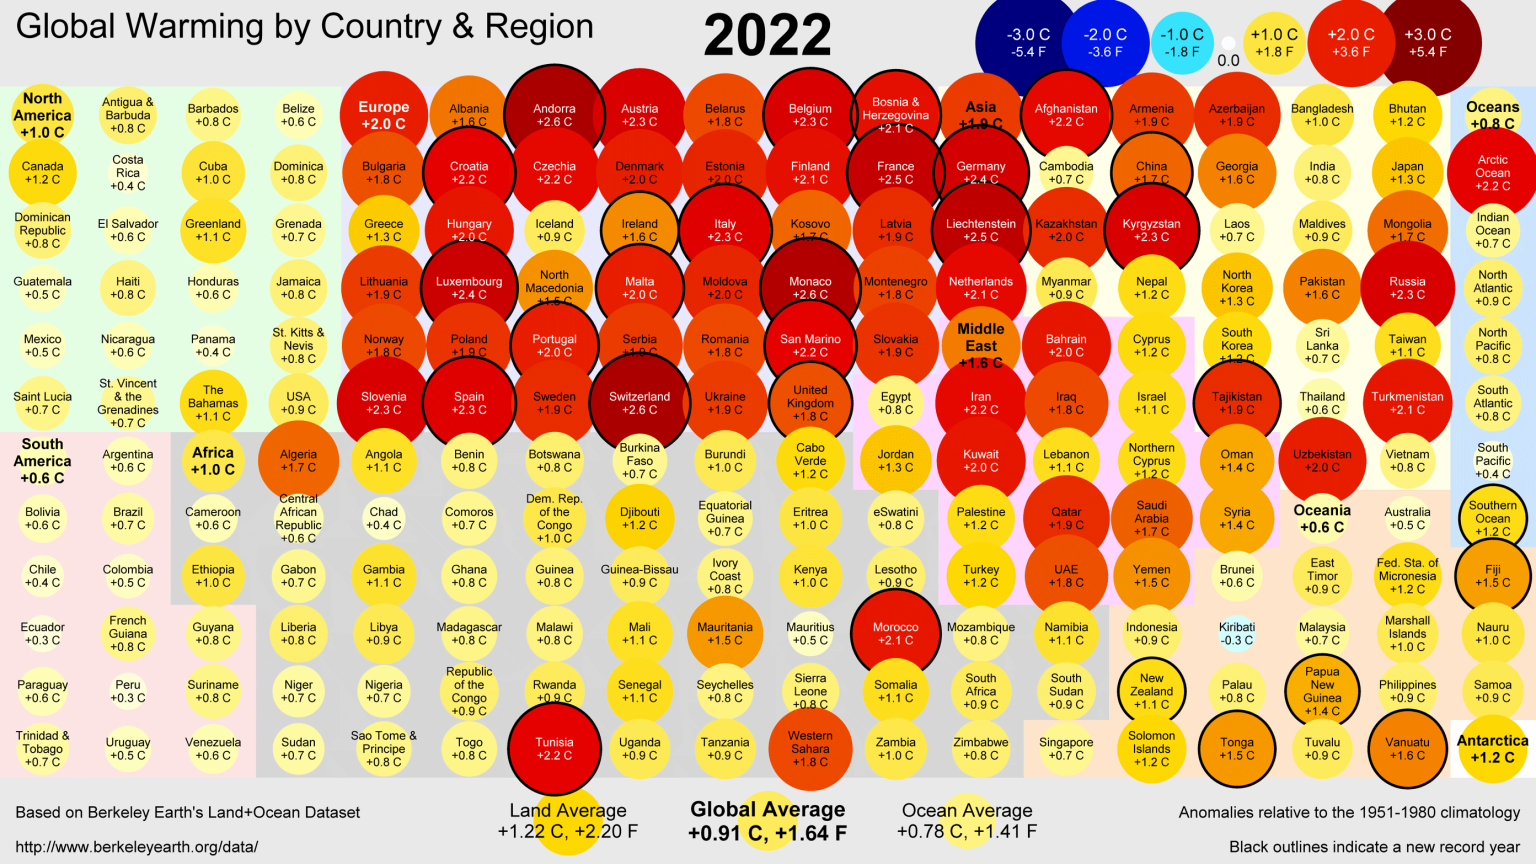
In the European Copernicus ECMWF dataset and the Berkeley Earth dataset, 2022 is the fifth warmest in the global instrumental record going back to the mid-to-late 1800s. Meanwhile, the National Oceanic and Atmospheric Administration and UK Met Office datasets pin it at No. 6, just below 2015 instead of just above it. NASA’s dataset has it tied with 2015 for fifth warmest. The total heat energy in the ocean, on the other hand, reached a new record. Over 90 percent of the total heat trapped by greenhouse gas emissions has gone into the oceans, and this value varies less from year to year.
There is nothing surprising about this. Berkeley Earth and NASA Goddard Institute for Space Studies Director Gavin Schmidt published predictions last year that 2022 was most likely to come in just slightly warmer than 2021.
Why were they able to do that? And why did 2022 end up where it did? The answer to both is that two factors tell you most of what you need to know about global temperature—the human-caused warming trend and the slow oscillation of La Niña and El Niño conditions in the Pacific Ocean.
This sloshing of surface water across the equatorial Pacific, with the wind sometimes piling up warm water on the western side (La Niña) and sometimes allowing it to stretch back across to the eastern side (El Niño), causes much of the year-to-year wiggling of average surface temperature. We’ve now been in a La Niña phase since late 2020, which has held the global average down—though this was the warmest of any La Niña year. These conditions can be forecast months ahead because they change slowly, which gives you a decent idea of how the global average will evolve.

 Loading comments...