NOAA released its monthly weather update Thursday, looking back at the fall and ahead through the rest of winter. As we close in on the (good riddance) end of 2020, its global temperature status is coming into focus. It’s looking like a bit of a coin flip between the year being the warmest or second warmest on record, depending on how you estimate the odds.
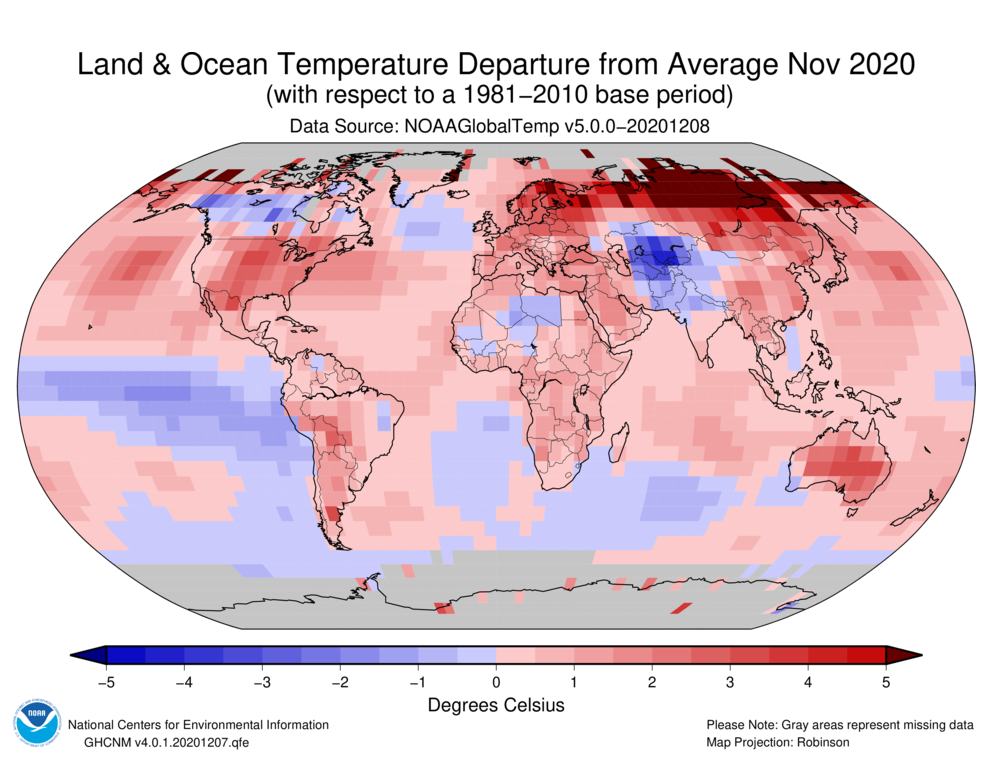
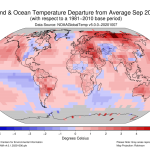
Globally, November was the second warmest on record, while the autumn period of September through November was the third warmest. The fact that this is true despite moderate La Niña conditions in the Pacific is notable, as those conditions bring cold, deep water up to the surface, which normally drags down the global average temperature.
At this point, 2020’s only competition for the warmest year on record is 2016, which was boosted by a strong El Niño. (That means more of the equatorial Pacific was covered by warm surface water.) The two years are so close that some datasets may even rank them in different order than others. NASA’s Gavin Schmidt, for example, estimates over 90 percent odds of setting a new record, but NOAA’s latest estimate is about 55 percent.
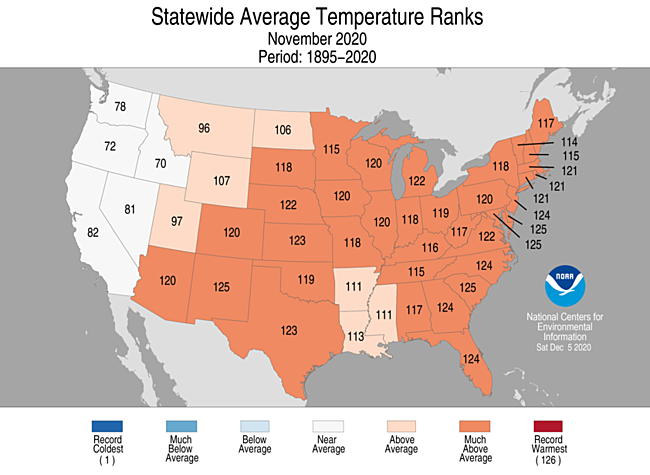
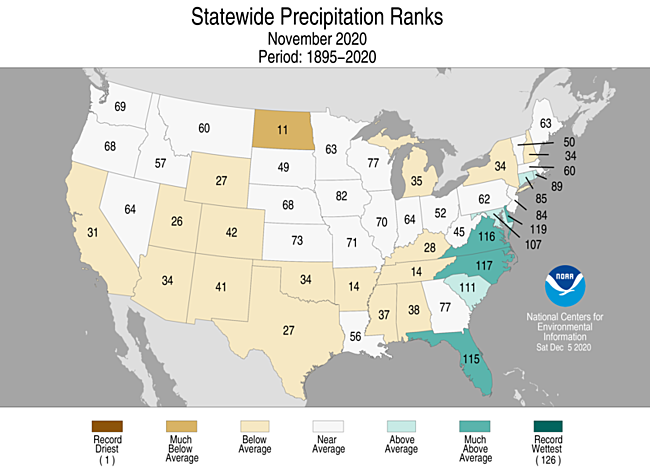
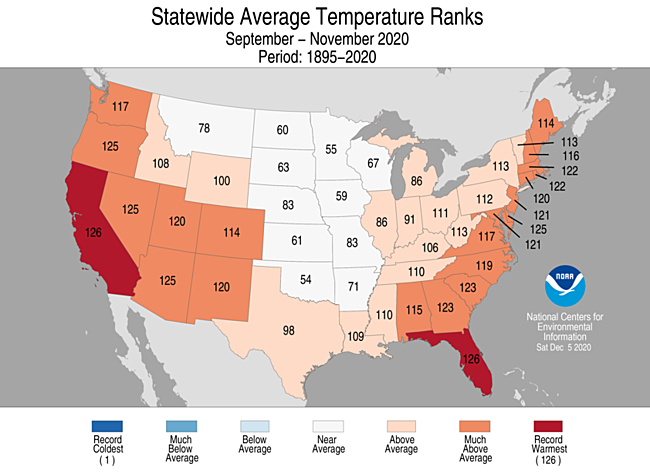
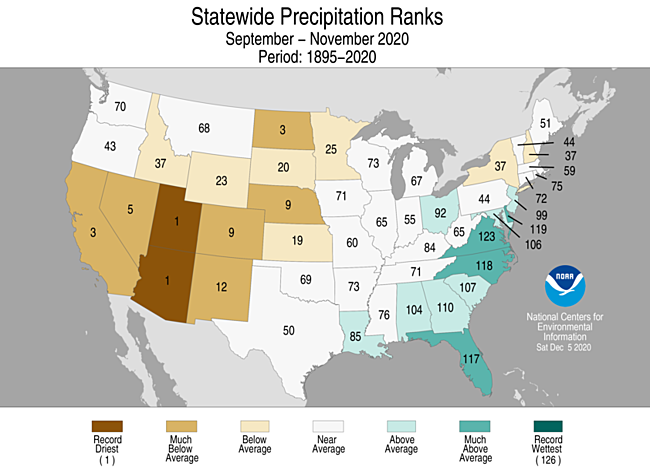
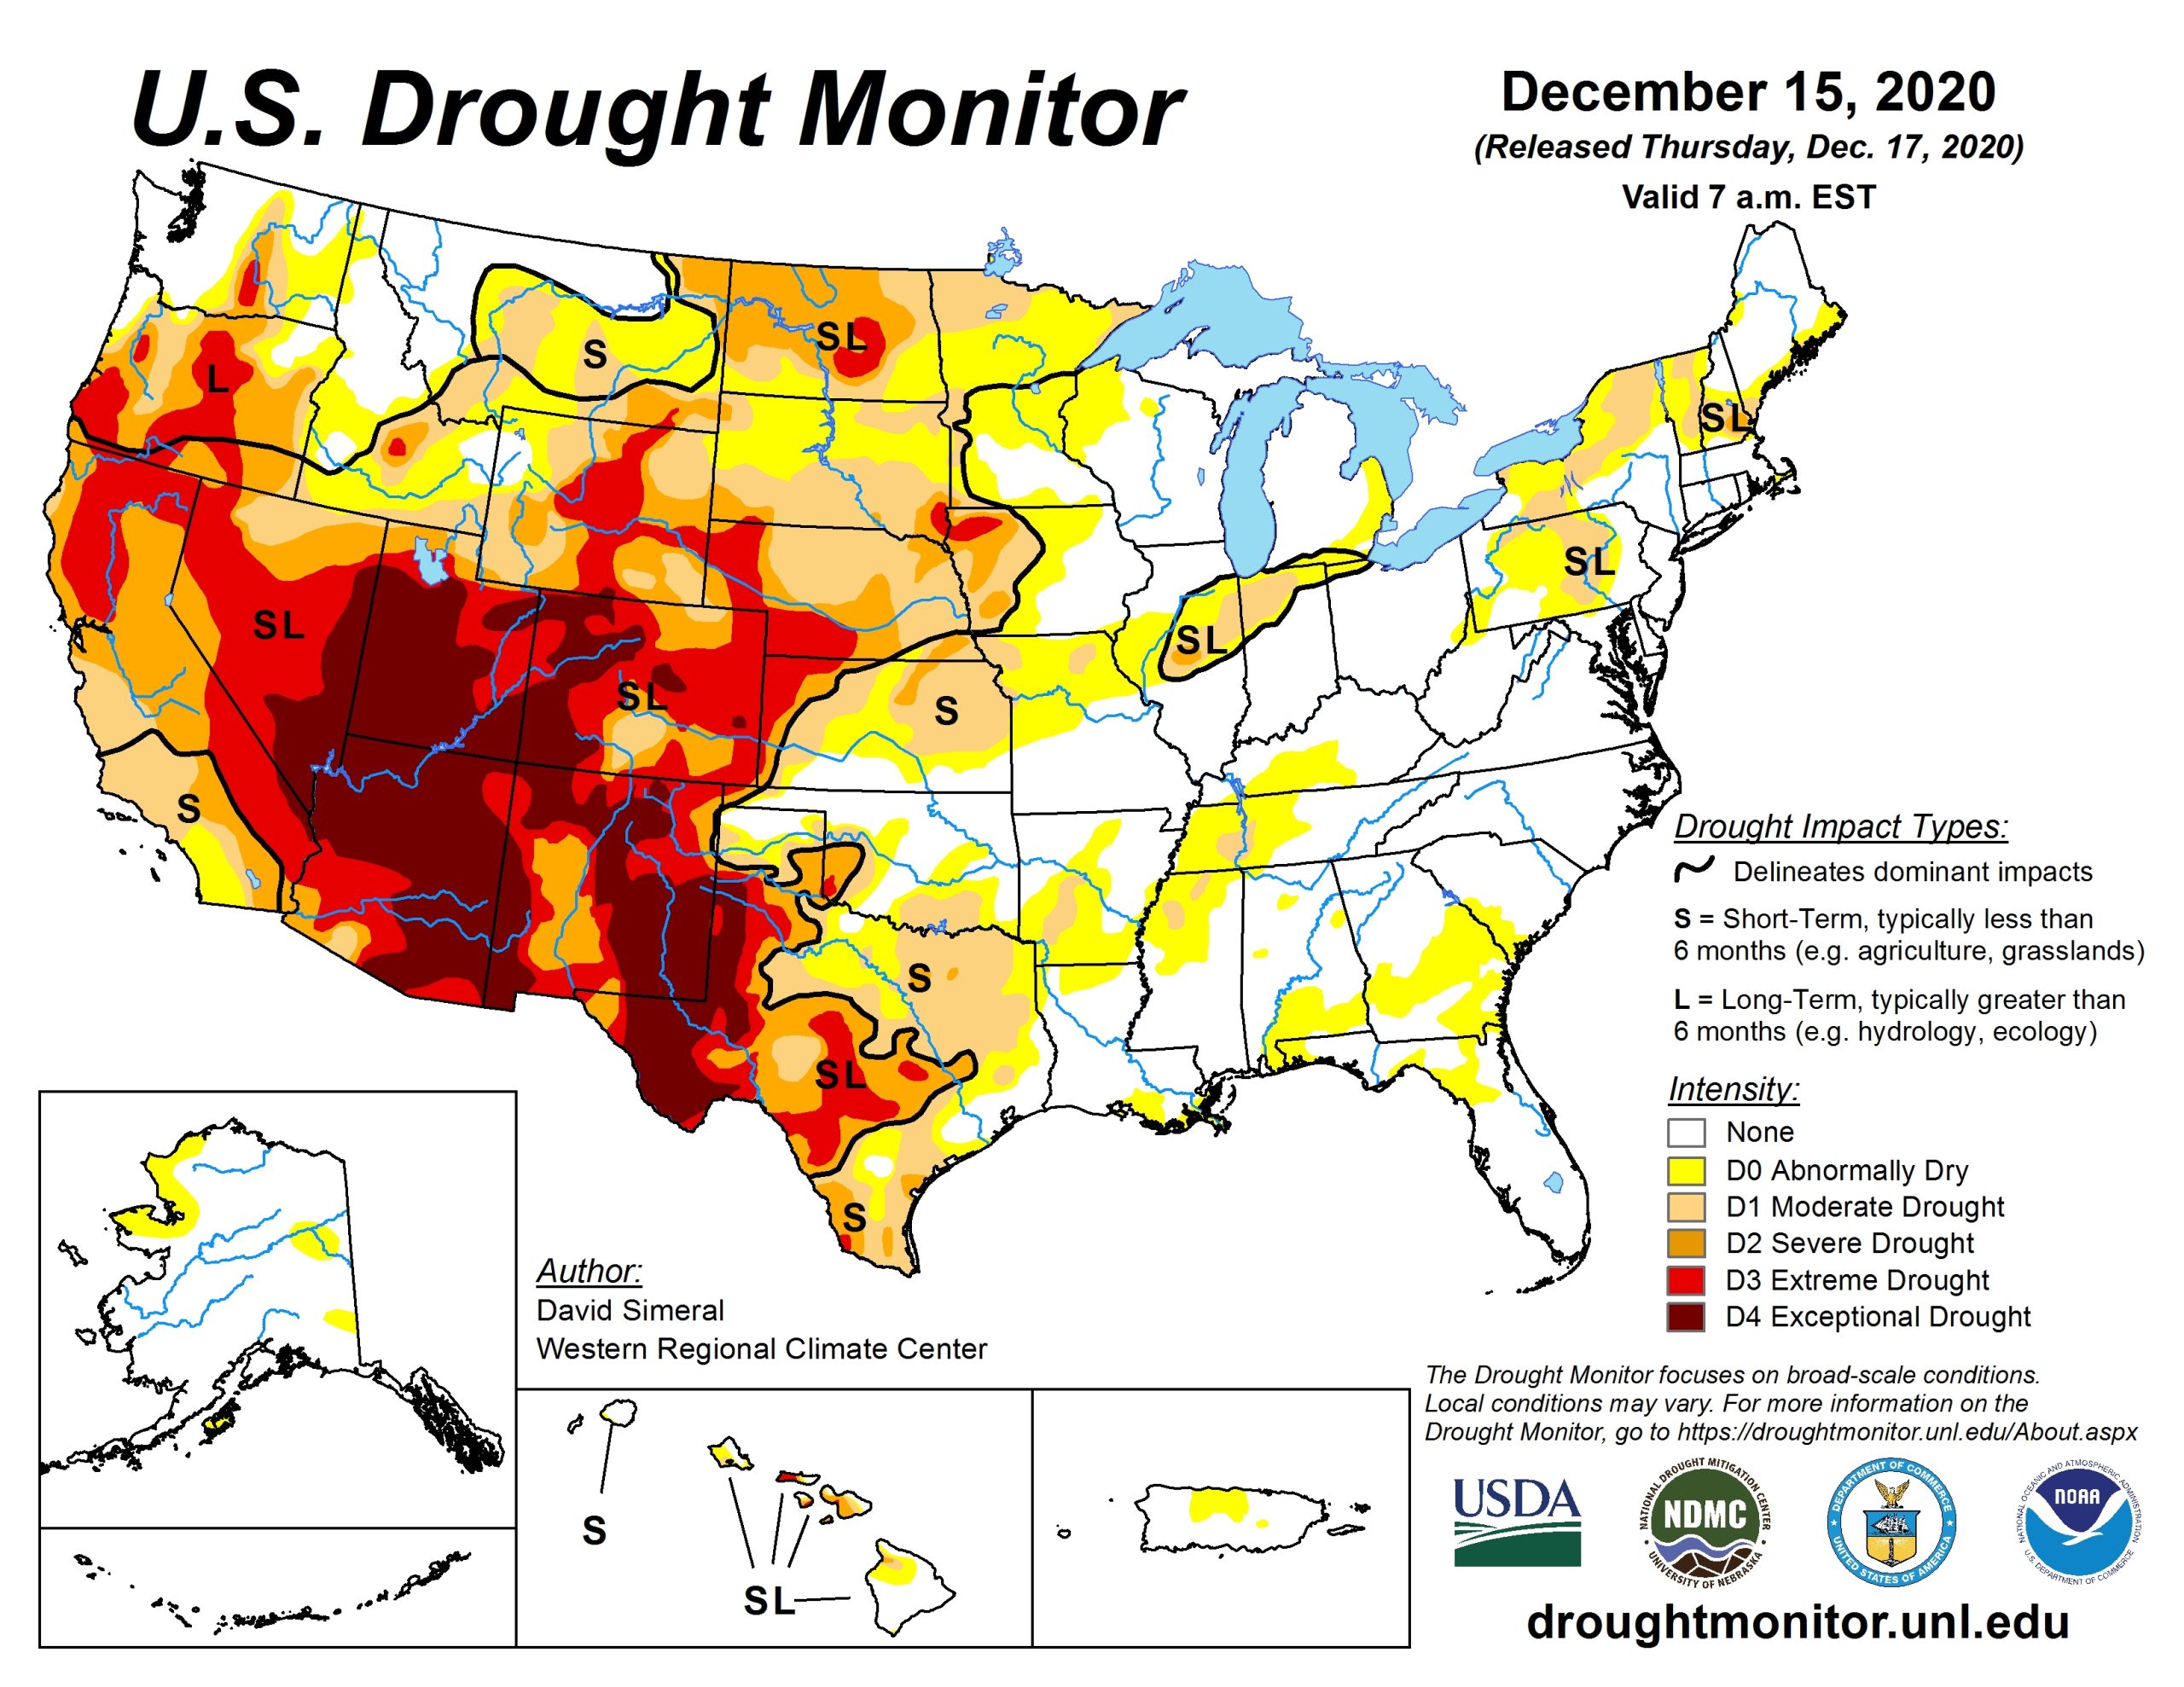
For the contiguous US, November was pretty consistently warmer than normal and dry. Specifically, it was the fourth warmest November on record and the 33rd driest. For the autumn season as a whole, it was the 11th warmest and only a little below average for precipitation—though that obscures a big east-west divide in rainfall.
No change in the weather
November’s weather was dominated by high pressure ridges across the US, which is why the weather pattern was so consistent. The only exception was the second week of the month, when a low pressure trough formed in the West. That brought cooler temperatures and some precipitation, particularly farther north. At the same time, the influence of Hurricane Eta produced rain in Florida and up the mid-Atlantic.
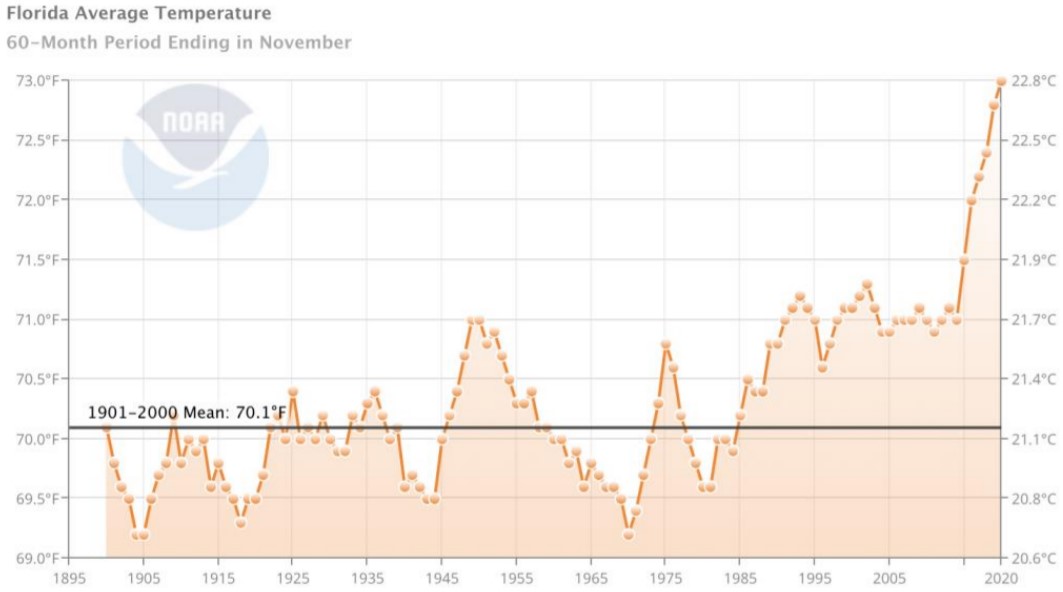
NOAA put a spotlight on Florida this month, where 2020 has so far been the warmest year on record. The state has been on a roll for about five years now, with 65 out of the last 68 months coming in above the long-term average—including the last 31 months straight. The last few years really stand out, as you can see in the chart below.

 Loading comments...