Climate change involves direct consequences on the cycling of water through our environment. The warmer atmosphere holds more moisture, making intense rainstorms dump even more water than they used to. On the flip side, warmer air can suck even more moisture out of the ground through evaporation, worsening droughts. These things should obviously result in changes for streams. But the amount of water in streams varies wildly under normal conditions, and it can also be affected by more than just weather. Finding trends in that data has proven difficult.
A new study led by Evan Dethier at Dartmouth College set out to group streams into physically meaningful categories, to see if consistent patterns emerge once apples are separated from oranges. That analysis does reveal some trends—both in extremes of high flow and low flow.
Going with the flow
Many efforts have found mixed trends between streams when analyzing records of peak annual flows, where records tend to go back farther than constant measurements. Attempts to look for regional patterns have largely relied on grouping by arbitrary boxes or political boundaries, which only have a limited connection to the landscape.
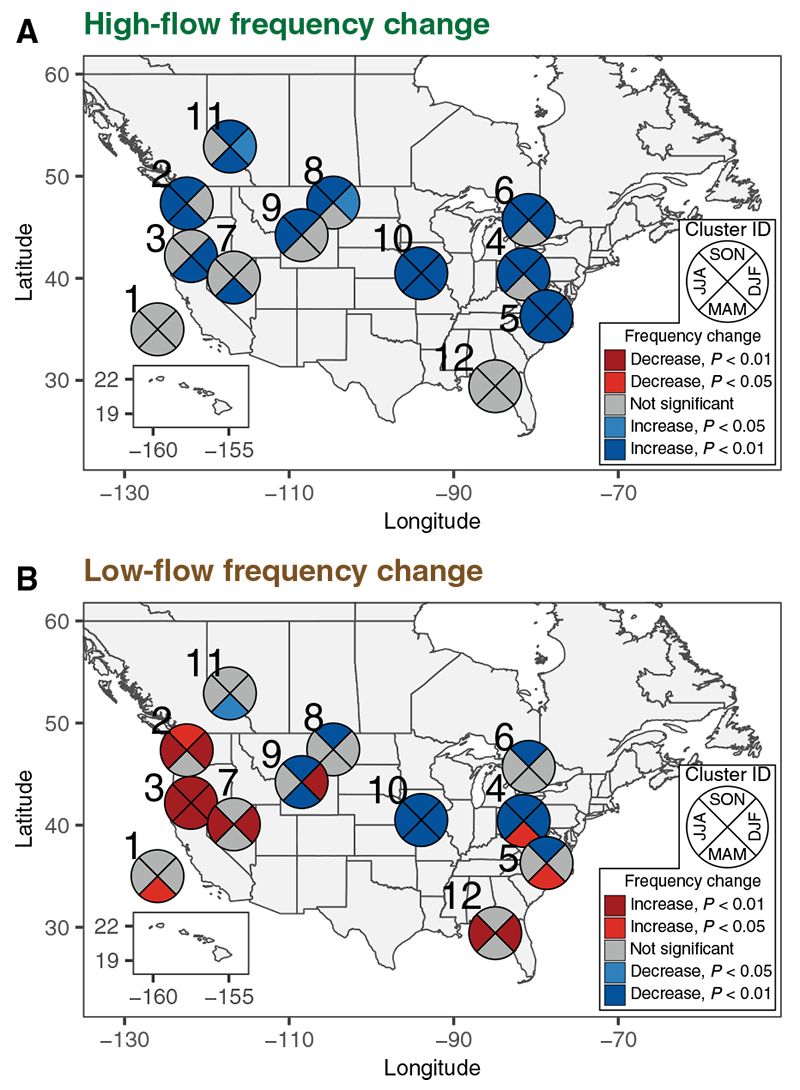
The new research included about 540 streamflow stations in the US and Canada, all from locations that have little human impact and that have at least 60 years of data. To put the stations in groups, they used their location, elevation, and seasonal flow pattern. The sites clustered into 15 different groups, 12 of which included a large enough number of stations to attempt a trend analysis with.
These groups were analyzed for changes in the frequency of extreme high and low streamflow on an annual and seasonal scale. The researchers calculated this for events of different rarities (50-percent chance per year, 20-percent chance per year, etc.) and from different starting years, but the results were generally consistent.

 Loading comments...